

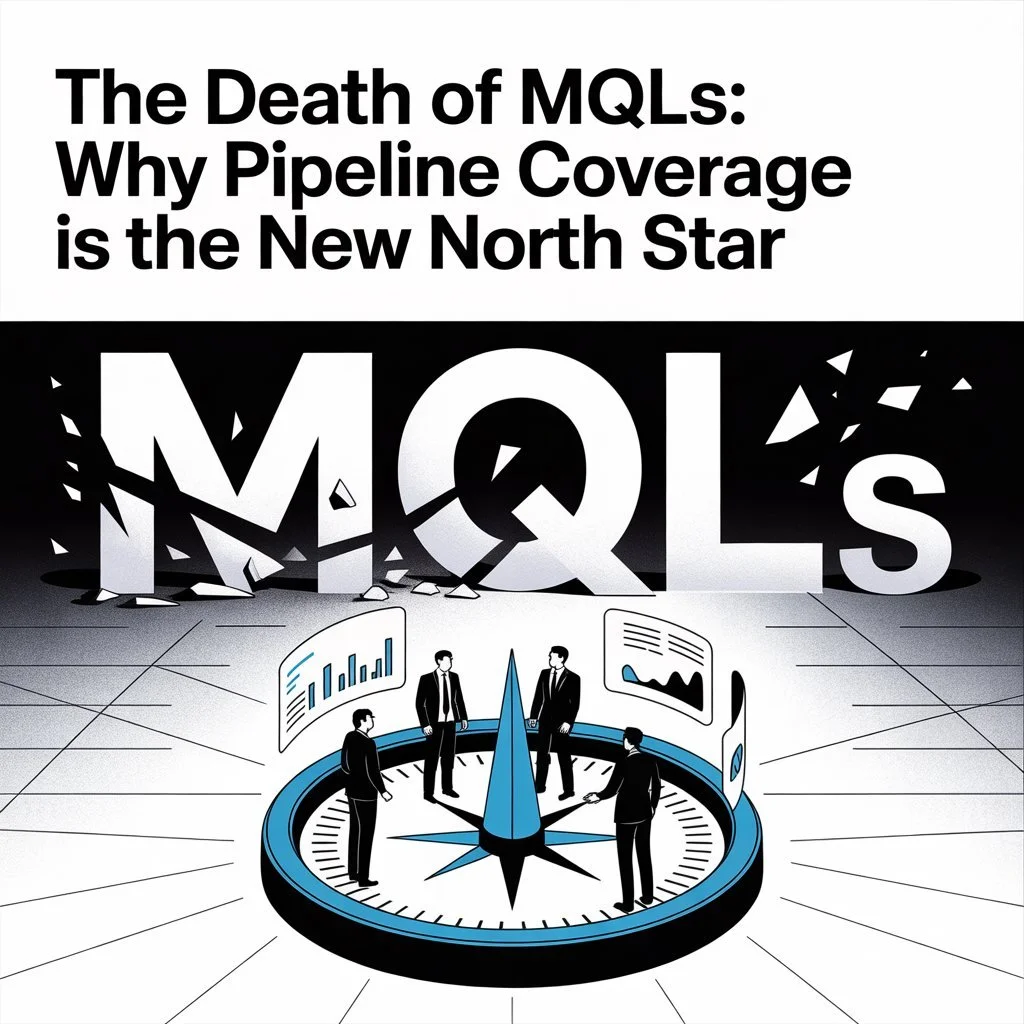
The Death of MQLs: Why Pipeline Coverage Is the New North Star
For a decade, the MQL (Marketing Qualified Lead) has been the star of the marketing dashboard. Entire careers have been built around optimizing for form fills, ebook downloads, and webinar registrations.
But here’s the reality: MQLs never predicted revenue. They only told us how busy marketing looked. And in 2025, companies can’t afford to optimize for “busy.” Boards don’t want activity metrics anymore. They want predictable, repeatable revenue. And that means it’s time to retire the MQL dashboard.
MQLs are like counting how many people walked past our lemonade stand instead of how much lemonade we actually sold.
The Autopsy: What Killed the MQL
MQLs didn’t just fade out quietly. They were killed by three forces that made them impossible to defend in the boardroom:
1. Measuring Fake Stuff
Downloading a whitepaper isn’t the intent. It’s curiosity at best, boredom at worst. Counting that as buying intent was like a restaurant counting everyone who looked at the menu as paying customers.
2. Sales Teams Calling BS
Ask a sales rep what they think of MQLs and you’ll get the same answer: “They’re garbage.” When 90% of “leads” say, “I was just browsing,” the credibility of the metric evaporates.
3. Buyer Reality > Marketing Fantasy
The neat Awareness → Consideration → Decision funnel was always a fantasy. Real buyers research on TikTok at midnight, ignore you for six months, then suddenly buy because their boss demands it. MQLs assumed a linearity that never existed.
The New Framework: Metrics That Actually Predict Revenue
Instead of chasing MQLs, high-growth companies now anchor on three board-level metrics:
Pipeline Coverage Ratio – How much qualified pipeline exists against revenue targets.
Pipeline Velocity – How quickly opportunities convert to revenue.
Revenue Attribution – Which activities actually influence closed-won deals.
Let’s break them down.
Pipeline Coverage: The New North Star
Pipeline coverage is simple in theory: how much money in real opportunities do you have compared to how much money you need to hit the target.
The problem? Most companies inflate it. They count anything sitting in their CRM. But “pipeline” only counts if:
The buyer has confirmed they’re purchasing.
Budget is allocated.
A decision timeline exists.
You’ve met real decision-makers.
You’re a viable option, not a price-check vendor.
The 3–4x Rule (and Why It’s Wrong Alone)
If you close 25% of deals, you need 4x pipeline to hit quota. But here’s the nuance most miss: timing.
If your deals take 6 months to close, and you’re aiming to hit this quarter’s revenue, only pipeline that can close within 3 months counts. That often doubles your actual requirement.
Pipeline Quality Scoring
Leading companies weigh pipeline by quality tiers (A/B/C). For example:
A-Grade: budget confirmed, decision-maker engaged → counts 100%.
B-Grade: budget range known, influencer engaged → counts 75%.
C-Grade: early stage, long timeline → counts 50%.
This prevents “phantom coverage” that inflates confidence but not results.
Pipeline Velocity: Speed + Conversion
Velocity measures how fast pipeline dollars turn into revenue dollars:
Formula:
(Number of Deals × Average Deal Size × Win Rate) ÷ Sales Cycle Length
Velocity audits uncover stage-level bottlenecks: discovery calls that don’t reveal pain, proposals stuck for weeks, or single-threaded deals that collapse when one champion leaves.
Tactics that boost win rates and velocity:
Disqualify faster - spend energy on winnable deals.
Multi-thread accounts - multi-contact deals win 67% more often.
Competitive intelligence - know when to fight, when to walk away.
Revenue Attribution That Works
Single-touch attribution is dead. First-touch gives too much credit to awareness, and last-touch overweights the bottom-funnel. Real attribution is multi-touch across the full journey:
First Touch (20%) – What started the relationship?
Lead Creation (20%) – What triggered sales readiness?
Opportunity Creation (30%) – What confirmed buying intent?
Closed-Won Influence (30%) – Activities that pushed the deal over the line.
Importantly, attribution must include post-opportunity influence: demo engagement, stakeholder attendance, ROI content & reference calls. That’s where most deal momentum lives.
Making the Shift: From Vanity to Value
The reality is you can’t rip out MQLs overnight. The transition works in three phases:
Baseline – Calculate current coverage, velocity, and attribution.
Parallel Reporting – Share MQLs alongside pipeline metrics to prove which predicts revenue.
Migration – Lead with pipeline metrics, demote MQLs to supporting data.
Boards don’t need more activity dashboards. They need confidence in revenue predictability. Show them pipeline coverage vs. targets, velocity trends, and attribution insights, and you’ll have their attention.
TL;DR-
MQLs are dead because they never told the truth. They looked like progress but rarely mapped to revenue.
The companies winning in 2025 are measuring what boards actually care about:
Do we have enough real pipeline?
How fast is it moving?
What’s influencing revenue?
If your board dashboard still leads with MQL counts, you’re speaking the wrong language. The faster you switch to pipeline coverage, velocity, and attribution, the faster you’ll earn credibility in the boardroom.
Stop counting menu readers. Start showing lemonade sold.